
If you are wondering what your business might sell for, you have almost certainly come across the concept of an EBITDA multiple. It is the most common shorthand in business valuation: take your normalised earnings, apply a multiple, and you have a rough enterprise value. But "EBITDA multiples by industry" is one of the most misunderstood topics in the market, because the industry average is only a starting point - where your specific business lands within (or outside) that range is decided by factors that have nothing to do with your sector.
This guide sets out indicative EBITDA multiples by industry for Australian businesses, then, more importantly, explains what actually moves your multiple up or down - because that is where the real value in a sale is won or lost.

What Is an EBITDA Multiple?
An EBITDA multiple is a valuation shorthand: you multiply a business's normalised EBITDA (earnings before interest, tax, depreciation and amortisation) by a market-derived number to estimate enterprise value. For example, a business with A$1 million of normalised EBITDA valued at a 5x multiple has an indicative enterprise value of A$5 million, before balance-sheet adjustments.
The multiple reflects how much buyers are willing to pay for each dollar of sustainable earnings, and it varies with industry, business size, growth, and risk. Two numbers drive the outcome: your normalised EBITDA (the true, sustainable earnings after adjusting for owner-specific and one-off items) and the multiple the market applies to it. Getting the earnings base right comes first - our guide on how to price a business to sell explains normalisation in detail, and a confidential valuation establishes a defensible figure.
Indicative EBITDA Multiples by Industry (Australia)
The table below shows broad, indicative EBITDA multiple ranges observed across Australian mid-market transactions. These are general market context only - not a valuation, offer, or prediction for any specific business. They assume normalised EBITDA and a genuine, competitive sale process.
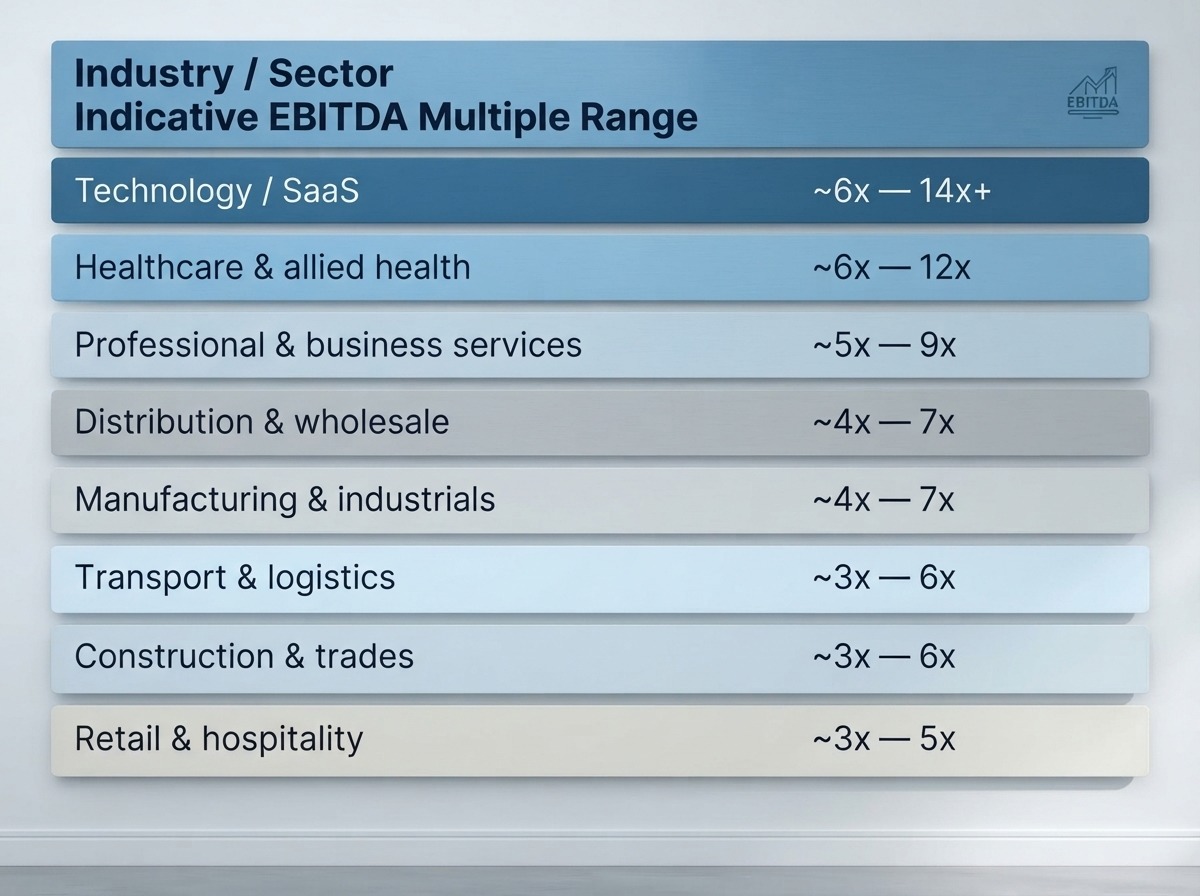
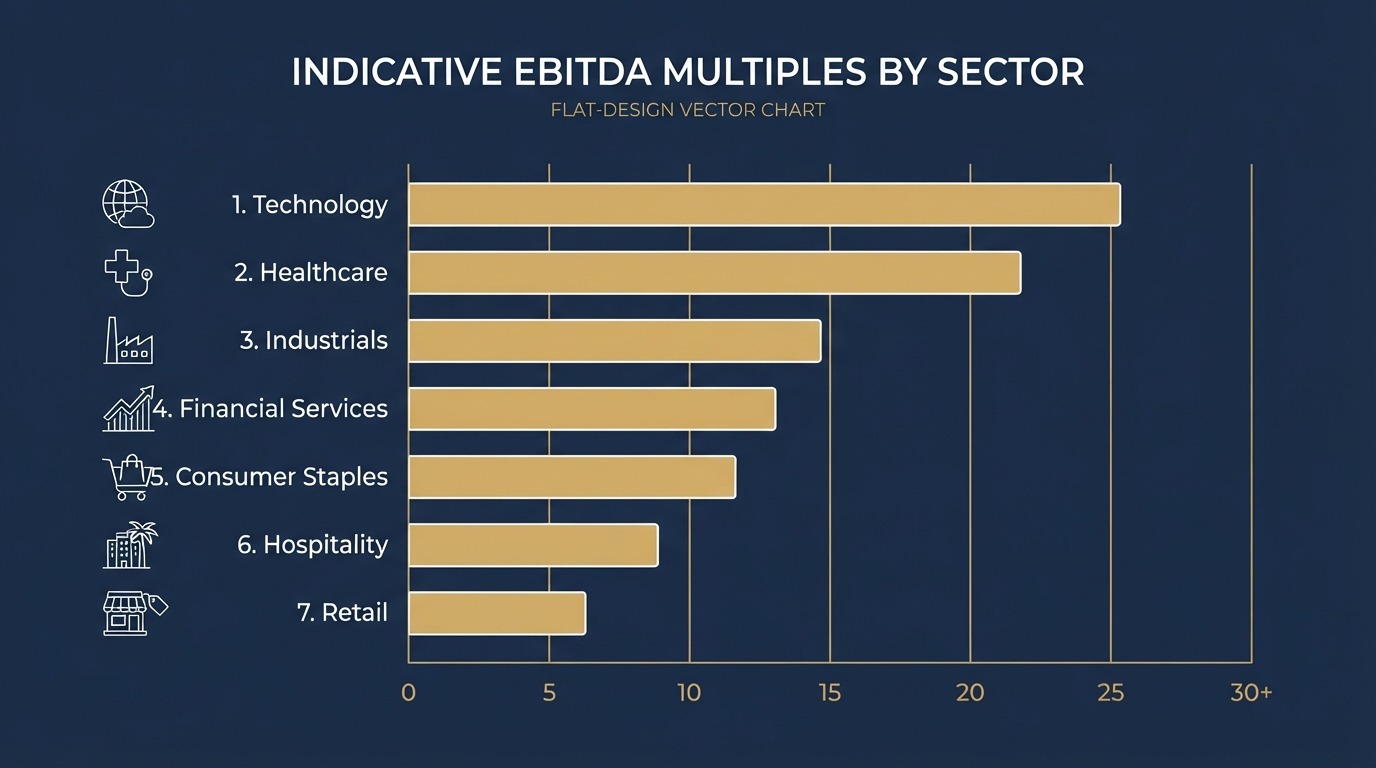
Indicative ranges compiled from published Australian mid-market transaction analyses current to 2026. Actual multiples vary widely with size, earnings quality, and deal structure. Higher-multiple sectors (technology, healthcare) tend to reward recurring revenue, high margins, and low capital intensity; lower-multiple sectors carry more capital requirements or customer concentration risk.
You can benchmark your own position against sector data using our industry valuation benchmarks.
Why Business Size Matters as Much as Industry
Size is one of the single strongest drivers of where a business trades - often more than the industry itself. Larger businesses command higher multiples than smaller ones in the same sector, because they carry less key-person risk, attract a deeper pool of buyers, and support more acquisition funding.
A business with A$5 million of EBITDA in a given sector will typically attract a materially higher multiple than a business with A$500,000 of EBITDA in the same sector. Once a business moves past roughly A$5 million EBITDA, it increasingly attracts private equity firms and strategic acquirers - a different, deeper buyer pool that can support stronger pricing. Our guides on private equity and family offices in Australia explain how these buyers value businesses at the larger end.
What Moves Your Multiple Within the Range?
This is where valuations are actually decided. Two businesses with identical EBITDA in the same industry can sell for very different multiples, depending on the qualitative factors buyers price in:
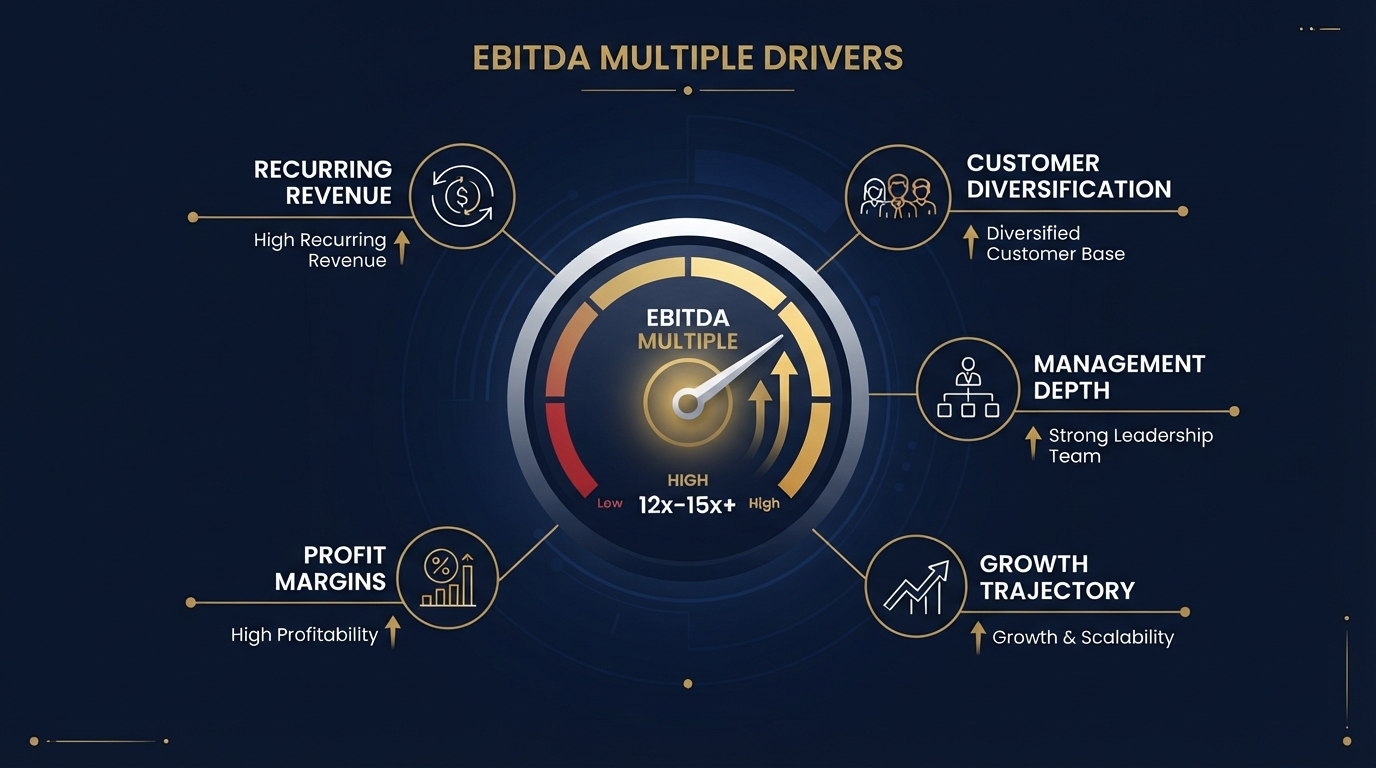
Recurring revenue. Contracted or subscription-based revenue is valued far more highly than one-off, transactional revenue, because it is more predictable and lower risk.
Customer concentration. A business reliant on one or two large customers is riskier, and buyers discount for it. Diversified revenue supports a higher multiple.
Management depth. A business that runs well without the owner in the room commands a premium; one that depends on the founder carries a key-person discount.
Growth trajectory. Consistent growth, backed by a credible reason it will continue, lifts the multiple above a flat or declining business.
Margin quality and capital intensity. Higher-margin, asset-light businesses (a reason technology and services sit at the top of the range) typically outprice capital-heavy ones.
Clean, verifiable financials. Numbers that withstand due diligence protect the multiple; inconsistencies erode it.
Most of these are within your control before you go to market. Our readiness checklist and exit readiness assessment show exactly what to strengthen to move your number.
The Sale Process Itself Moves the Multiple
One of the most overlooked drivers of your final multiple is the quality of the sale process. A genuinely competitive process - one that puts multiple qualified buyers in competition - consistently achieves materially higher multiples than a single, bilateral negotiation. Analysis of Australian mid-market transactions has repeatedly found competitive processes deliver a meaningful premium over one-on-one deals.
This is a core reason experienced representation pays for itself. A well-run process, supported by a credible investment memorandum, creates the competitive tension that lifts the multiple - as covered in why using a specialist advisor maximises your sale price.
EBITDA or SDE? A Note for Smaller Businesses
For smaller, owner-operated businesses - typically those under around A$1 million in earnings - buyers often price on SDE (seller's discretionary earnings) rather than EBITDA. SDE adds back the owner's salary and benefits, and the multiples applied to it are lower (commonly in the low single digits), because a large share of the value depends on the owner personally.
Applying an EBITDA multiple to an SDE figure, or vice versa, is one of the most common valuation errors, and it produces a wildly inaccurate result. The earnings basis must match the multiple.
Why an Industry Multiple Is Not a Valuation
An industry multiple is context, not a valuation. Lifting a multiple from a chart - especially US charts, which skew toward much larger deals and a deeper buyer pool than the Australian mid market - and applying it to your business without adjusting for size, earnings quality, and risk will produce a number the evidence does not support.
A credible valuation triangulates across methods: an earnings multiple grounded in genuinely comparable Australian transactions, sometimes a discounted cash flow analysis, and a realistic read of current buyer appetite. That is the difference between a number that sounds good and one that actually closes - a theme we return to throughout our complete guide to selling a business.
Get a Real Number for Your Business
Blackmont Advisory provides business owners with honest valuation guidance grounded in current market appetite and genuinely comparable evidence - not a multiple pulled from a chart. As a boutique, senior-led M&A firm based in Melbourne with a global network of buyers, we assess your normalised earnings, the multiple range realistic for your sector and size, and the specific steps that would move your number before you go to market.
Understanding EBITDA multiples by industry is a useful starting point. Knowing where your business sits within its range, and how to improve that position, is what actually determines your sale price.
Want to know your realistic number? Start with a confidential valuation.
This article provides general market information about EBITDA multiples and business valuation. It is not a valuation, offer, or personal financial advice. Indicative ranges vary with market conditions and business-specific factors; speak with a qualified advisor about your specific circumstances.
Frequently Asked Questions
What is a good EBITDA multiple for a business? There is no single "good" multiple - it depends on your industry, size, growth, and risk profile. Australian mid-market businesses broadly trade in indicative ranges from around 3x to 14x+ normalised EBITDA, with technology and healthcare at the higher end and retail, hospitality and trades lower. Where your business sits within its range depends on recurring revenue, customer concentration, management depth, and margins.
How do I calculate my business value using an EBITDA multiple? Start with your normalised EBITDA - reported earnings adjusted for owner-specific and one-off items - then apply a market-derived multiple for your sector and size. For example, A$1 million of normalised EBITDA at a 5x multiple gives an indicative enterprise value of A$5 million, before balance-sheet adjustments. The normalisation step is critical; an unreliable earnings base produces an unreliable result.
Do bigger businesses get higher EBITDA multiples? Generally, yes. Larger businesses attract higher multiples than smaller ones in the same sector because they carry less key-person risk, appeal to a deeper buyer pool (including private equity above roughly A$5 million EBITDA), and support more acquisition funding.
Why do technology and healthcare businesses sell for higher multiples? They tend to combine recurring revenue, high margins, low capital intensity, and scalability - all characteristics that reduce buyer risk and support a premium. Capital-heavy sectors with more customer concentration typically trade lower.
Is an industry EBITDA multiple the same as a valuation? No. An industry multiple is general context, not a valuation. A credible valuation adjusts for your business's specific size, earnings quality, growth, and risk, and triangulates across comparable transactions and other methods rather than applying a chart figure mechanically.